Introduction:
By the numbers from Autoblog.com reports monthly car sales for almost every manufacturer. It started in 2005 and continues to today. I gathered the data into a spreadsheet which you can see here(). My main objective was to see group manufactures into clusters and see what companies are directly related. For example; are the monthly change in car sales for Acura more similar to Honda, its parent company, or BMW and Mercedes. If it were more similar to BMW then one could conclude that Acura is a 'true' luxury brand. Using monthly car sales is an indirect way of achieving this. That's my original intention. However, I may come up with a few questions of my own when looking at the data...
This post is really just exploratory data analysis and focuses on plotting manufactures. I've grouped the manufactures based on my own knowledge and what I think should be considered similar manufactures.
Japan Big 3
Here we have Japan's big 3 auto manufactures; Honda, Toyota, and Nissan. We see a general decrease in car sales in second half of 2008 and they have yet to recover. The surprisingly large number of cars sold in summer 2009 was a result of Cash for Clunkers. Wonder if US manufactures had a large increase like that too...
Big 3 US. Same general decline until 2009, then steadily increasing after. No big increase for Cash for Clunker's dates like Japanese manufactures.Suzuki dying is the only thing I find sad about this graph.
Mitsubishi looks dead compared to the jagged ups and downs of Mazda and Subaru. I wonder how long Mitsubishi can stay around for.
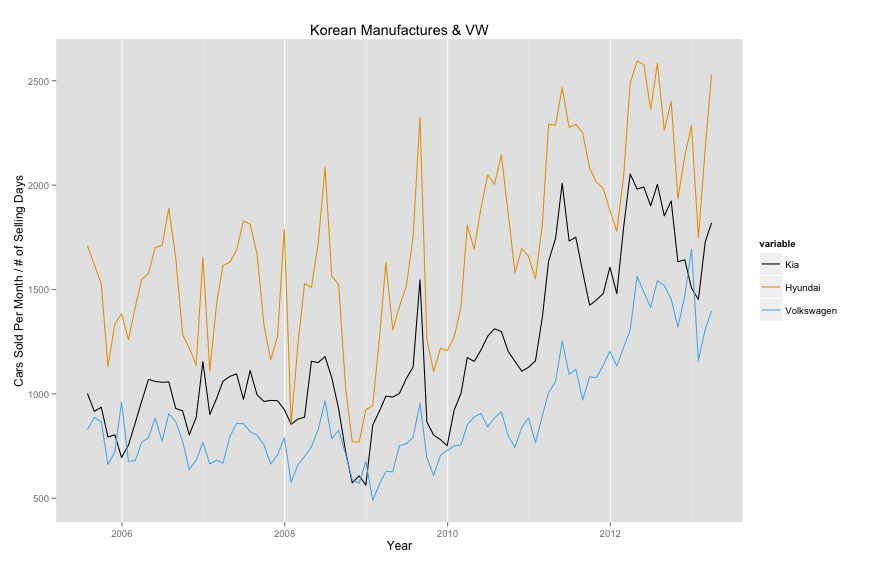
Obviously Kia and Hyundai should be graphed together. I included VW since it looked similar enough and has been targeting US market specifically with poorer quality (cheaper) Passat. All three haven't been significantly effected by general decline due to economy and they've all increased since 2009.
Lexus is biggest Japanese Luxo brand while Acura and Infiniti are far behind.
With all


No comments:
Post a Comment