sweissblaug

Thursday, March 12, 2020

Can Trade with China Predict COVID-19 Cases? Part 2


In my last post I discussed whether exports from china can explain current COVID-19 rates. There were some criticism with the analysis.

The first was that I assumed some sort of causal relationship . I probably shouldn't have said whether trade can 'explain' COVID-19 rates. What I meant whether trade can 'predict' the differences in COVID -19 rates.  The mechanism itself seems obvious - increased contact should increase probability of spreading diseases. Of course $ amount of trade is imperfect - I expect $1million of food exports to have more of a chance to have diseases than $1 million of phone exports - but it seems like a decent proxy for 'connectivity'.

The biggest critique was that I didn't take into account population sizes. I thought that was a decent critique so have run results again and reproduced similar charts as before. Feel free to comment.


Below is a histogram of log per capital COVID-19 cases. Seems far more symmetric taking into account population sizes.


Below is scatterplot of log(covid-19 cases / population) ~ log(chinese exports) for each country. Looks like a fairly strong relationship. There are several small country outliers that reduces r^2 of regression to ~ .24. This is an increase in r^2 relative to not taking into account population.


I ran a similar model of a random forest with all sectors of trade. Below is predicted vs actual plot. 


The relationship now is ~ .55 r^2 which shows is an increase in what was previously posted and the univariate regression above. Iran is still the largest outlier. Bahrain and Iceland are also now outliers.

Below is an updated importance plot. Nickel and sunflower seeds are still highly predictive of COVID-19 cases. I'm sure many of these correlations (not causations!) are geographic in nature. But some exports may be more likely to carry diseases like 'articles of gut'. I think the best way to treat the below graph is a rough exploratory device not meant to draw grand conclusions.


The conclusions don't dramatically change form previous analysis. If anything the results have gotten stronger.

github

Posted by sam at 8:09 PM No comments:
Email ThisBlogThis!Share to XShare to FacebookShare to Pinterest

Tuesday, March 10, 2020

Can Trade Explain Covid -19 Cases?


I've updated some results. Find them here

TLDR: I've found an association between number of people that tested positive for COVID-19 in a country and imports from China. In addition there are particular industries that are particularly correlated with COVID-19 rates. Iran is still an outlier taking this information into account. 

Intro:

Coronavirus (COVID-19) rates of infection outside of China have not applied to countries uniformly. As of 3/9/2020 Italy (9,172), South Korea (7,578), and Iran (7,161) have a disproportionate number of cases relative to other countries such as the US (605). Below is a histogram showing the distribution of cases in each country and it's clear it is right skewed and non-uniform. 

What causes such unequal distribution of COVID-19 cases among countries? I assume some degree of 'connectives' between countries would be a correlated with these rates. In particular I assume an increase in imports from China will lead to more cases in the importing country. 

To investigate this I looked at data from https://oec.world/en/resources/data/. This includes bilateral trade data between countries and is broken down into hundreds of different categories of products. I'll look at a few things 1) are the outliers of Iran, Italy, and South Korea explained by trade with china? and 2) are some categories of traded products more correlated with rates of infection and 3) if so which products are more correlated?


1) Are Chinese Exports Correlated with COVID-19 Rates? 

Below is a plot of COVID-19 rates by total Chinese exports for each country in 2017 (the latest data available). One can see a fairly strong association between these two variables. However there are a few outliers. Notably South Korea, Italy, and Iran are still above expected along with smaller countries and territories like San Marino. 

Running a random forest of log(COVID-19-rates)~log(total_chinese_exports) yields an out-of-bag (OOB) r^2 of .12. So while relationship appears to be highly correlated there are enough outliers to decrease the 'explained' variance in infection rates. 


2) Are there product categories among Chinese Exports that are more correlated with COVID-19? 

To test this I ran a random forest of log(COVID-19-rates) on all export amounts broken out by categories. This is a very wide data set with 97 countries (observations) and over 1200 categories (explanatory variables). Even this wide dataset produced an OOB r^2 of .49 meaning that it captured much of variance not captured by previous univariate model. 

Below a scatterplot of COVID-19 rates by these OOB random forest predictions. San Marino does not look like a large outlier anymore but Italy and South Korea do. Iran looks like a much larger outlier. 


3) Which product categories are more correlated with COVID-19? 
To answer this question I setup a model of same form as the random forest in 2) but used a lasso regression to apply variable selection. Below are the scaled coefficients kept by lasso regression. 


One can see Chinese nickel powder and sunflower exports are more correlated with COVID-19 rates in importing country.

I looked at these and couldn't really make a story behind it. For instance the 7th most important feature had to do with swords and bayonets. I have no idea what this means :).

Conclusion:
It appears trade is highly correlated with COVID-19 rates. In addition the evidence suggests that some industries are more correlated with COVID-19 rates than others (do to increase in r^2 between 1) and 2) ).

However, it's still not clear why countries like Iran have such high rates. Perhaps the data is stale since it was from 2017 or maybe Iran-Chinese trade is under reported in this dataset due to US sanctions.


Github

Posted by sam at 8:04 PM 3 comments:
Email ThisBlogThis!Share to XShare to FacebookShare to Pinterest
Labels: "R", R

Wednesday, January 1, 2020

What Were IRA Facebook Objectives in 2016 Election?


The Internet Research Agency (IRA), funded by friends of Russian Intelligence, used social media to try to influence the US 2016 election. They did so in an elaborate and systematic fashion. While the number of purchased ads and money spent on Facebook was small there were significant resources devoted to this endeavor as a whole. 

It’s overall objectives have been to explicitly help the more non-traditional candidates in the 2016 presidential campaign (p 23 of Mueller Report) and, more broadly, to sow distrust in the American populace towards its institutions (p 4 of Mueller Report). It used a variety of tools such as bots, fake twitter accounts, and advertising on Facebook to do so.

However, it’s unclear what the IRA optimize when they made these Facebook Advertisement. Part of the issue is the difference between outputs and the outcomes of these campaigns (terminology taken from Hostile Social Manipulation from Rand). Outputs are the observable metrics that can be tied to a Facebook campaign (eg likes, impressions, etc) while outcomes are the desired changes in public opinion the advertisements are trying to change. Since the outcomes are unobservable they would have had to use the outcomes of these campaigns as proxies. What were their objectives while looking at these proxies?
Looking into this is interesting for a couple reasons. The first is that learning about IRA objectives might tell us how to better combat these campaigns in the future. There is no reason to suggest the IRA or other nations will stop attempting to manipulate populations through social media so this problem will only get bigger so any research might help. Another reason is that, as a data scientist myself, I could learn something in how to advertise more effectively.
This analysis will attempt to answer what particular objectives the IRA were looking to optimize with regards to the information they had available for Facebook ads; Clicks, Impressions, and Costs. I've found evidence that the IRA adapted it’s ad placement to be more cost effective in terms of click through rates suggesting they tried to optimize some sort of Clicks/Cost metric.

General Idea of Analysis

The general idea is to think like a data scientist. If I were trying to optimize something I would look at the performance of previous campaigns and make future decisions according to my objectives. The decisions in this case are what kind of ads to deploy to which people. While I do have the text associated with each ad I will ignore that information for now and focus only on whom the ad targeted (Facebook allows a marketer to target based on just about any demo, interest, or behavior. Focusing on this should make the problem more tractable).
I try to simulate this activity in two steps for a given time period.
1  -  The first is to select a period in time and build ridge regression’s on the five available metrics and interactions (Clicks, Costs, Impressions and Clicks/Costs, Impressions/Costs I added because I thought they'd be useful) using ad features (targets like 'users between ages of 18-65' or 'liked MLK') as explanatory variables.  Each explanatory variable will therefore have 5 regression coefficients.
2  -  If they were updating ads based on previous information I’d expect to find some correlations between previous performances (estimated coefficients of step 1) and future decisions. Therefore I treat these regression coefficients as explanatory variables in a second step; regressing on number of times that feature occurred in ads in the subsequent period.
An elaboration of this method and what it is trying to capture is in order. The IRA may explore different subsets of people to target ads to and adapt as they gain more information. They can see themselves what features are positively / negatively correlated with metrics, something we are trying to recreate in step one. The IRA would then make decisions on future ads. 
Suppose the IRA was interested in maximizing impressions without regards to costs or clicks. In the second step we would expect to see a positive relationship between features that had large positive coefficients for impressions but no relationship with coefficients for costs or clicks. Thats the theory anyways.
I do not expect this to be the ‘true’ data generation process. All I’m trying to do is get features that can roughly capture the efficacy of ads targeting and future decision making. To some degree this is kind of hacky way of trying to do Inverse Reinforcement Learning.

Data And EDA

The US government and Facebook found released ads that were purchased by the IRA. The data I used was found at https://russian-ira-facebook-ads.datasettes.com/ and they cleaned up the metadata very nicely. However, only those ads that paid in Rubles (yes they didn't hide their tracks too much) had costs data. I subsetted data to those observations. In addition I focused on 2016 election and right after of dates between 2016-01-01 and 2017-02-01. This left with 1296 ads in the data set.
Below is a pairs plot of all output metrics in log scale.

Pairs Plot of Metrics


One thing to note is the frequency of ‘horizontal’ points for costs. Since These are clustered around integer values it is most likely due to ‘max spend’ limits facebooks allows purchases to do.
The highest correlations are between Impressions and Clicks. Correlation between Impressions and Costs are also high most likely because IRA chose to be charged by Impressions and not Clicks which is another option.

For targeting data I used only those that have more than 10 observations and left with a 240 targets. Below is a plot of most common targeted data. 


After some generic ones (NewsFeed, Desktop, English) one can see they focused heavily on African Americans. In a previous blog I mentioned how these really took off in summer / fall of 2016 right after Manafort gave Russians some as yet to be disclosed polling data (but thats another story).

Results

For a particular date I looked at ads that were deployed between 28 days prior and up to that date for step 1) described above. I then look at the subsequent 7 days following that day and count number of times each topic has been deployed in an ad. I do this calculation for every week for dates between 2016-01-01 and 2017-02-01. There are 57 overall time periods and 240 features. Combined we have 13680 ‘observations’ of regression coefficients along with. The reasons why I chose a 28 day lookback for step 1) and 7 day look forward for step 2) was fairly arbitrary. I did try other dates and got largely similar results. 

Below is what one time period coefficients look like for Costs and Clicks.


This was during the week of the 2016 Election. Each point is a topic along with it’s estimate regression coefficient on each axis. The size is how many subsequent times that topic was named in the subsequent week. For example; targeting users with the "United States" was associated with more costs and more clicks and it was one of the commonly used target in subsequent 7 day period. Conversely the 'Pan Africanism' is associated with relatively low costs and clicks.

I included an x=y line for clarity. One can see that most observations are above this line indicating that some sort of click per cost metric is important.


We can see all time periods / coefficients in a pairs plot below.
The the first five variables are the estimated coefficients for all targets for all time periods. The final column is each coefficients following weeks number of occurrences. The highest correlation among estimated features is between Costs and Impressions adding further evidence that they are charged by impressions and not clicks. 
We also see that Costs and impressions are negatively correlated with counts while clicks are positively related. I take this to mean that IRA was interested in maximizing its non paying metric of clicks while minimizing costs of and subsequently impressions. Finally, the clicks/costs metric is slightly more correlated with counts that impressions/ costs topics.
For these reasons I ran a regression of log(counts+1) (l Iogged due to skewness in data) on costs, clicks. and clicks/costs while dropping impressions features. I did so because there is too much collinearity between impressions and costs and I think they tracked the same thing.

Below is a regression output of those features with time dummy features and the number of times the topic was targeted during current time period (time features excluded from output due to length).


Observations13680

Est.S.E.t val.p
(Intercept)-0.260.05-5.350.00
scale(coefs_costs)-0.080.02-3.460.00
scale(coefs_clicks)0.080.023.190.00
scale(coefs_clicks_cost)0.020.021.060.29
scale(log(counts_topics_current + 1))0.640.0199.510.00
*removed Date Dummies for readability
As expected there is a negative relationship with regards to costs but a positive one with regards to clicks and both are stat sig.
To further look into this relationship I built a random forest model with same features as above (but not clicks / costs since the model should be able to make that interaction). To see if these estimated coefficients actually 'add' anything I build two random forests; one with only date and current counts and one with those features in addition to costs and click coefficients. The second model increases out of sample % var explained by ~ 1.2% and explains ~57.7% of variance. So the added predictability is small but there!
Below is a partial dependence plot of costs and clicks coefficient explanatory variables.
This shows that the IRA was focused on minimizing costs while maximizing clicks and is in broad agreement to regression output printed above. 

Conclusions


Overall it appears that IRA did try to maximize clicks on Facebook ads while minimizing costs. I've described these results to some friends and got the response 'well yea ok - that makes sense'. It's not a very surprising result.. it's almost banal. But it does underscores the fact they're using similar techniques as I might for helping a business... its just they're trying to f*** with my country.

This did not answer whether the IRA changed public opinion or had defining influence and 'hacked' the 2016 election. I don't think there is enough public information to answer that question. (side rant: I bet Facebook could come up with a decent analysis of that. They know who saw the ads / posts of IRA and know similar people who didn't see ads and where they probably voted. Couldn't Facebook could look at precinct level results and do some sort of ecological inference?)

But even if they didn't hack the election it seems like they did some decent analysis on Facebook ads that goes above and beyond what Facebook gives to its ad purchasers. Facebook does not give performance indicators on a target level basis. But the evidence presented here suggests they did some decent analysis on target level attributes. They might have hacked Facebook and that gave me an idea.

github code

Posted by sam at 3:32 PM No comments:
Email ThisBlogThis!Share to XShare to FacebookShare to Pinterest
Labels: "R", R

Hacking Facebook Targeted Ads

Facebook's Ad Targeting allows advertisers to pinpoint who they want to target their ads to. These targets can be very specific and have been useful in business and political campaigns. However Facebook does not give data on which targets were most effective. After doing some research on Russian Facebook Ads that used this feature I think one can 'hack' this it to build ones own model and optimize who should see the ad. 

The general idea is that one can create a dataset by randomly selecting different demographics / interests and randomly assigning the message. With this one can build kind of an ecological (since we don't se user level response, just aggregates) -  uplift model and target to people with more control than Facebook might give you. I've written about uplift modeling here and here before and those techniques can be applied to this as well. 

For example, suppose you have two different advertisements to give to people but you are unsure which people should see which ad. One can randomly pick demographics, likes or interests and assign one of the two ads. Repeating this over many times will yield a dataset with performance metrics of each ad (costs, clicks, impressions) along with the targeted demos, and the ad assigned. Then one can build models on each metric on the ad and demos/like features to predict counterfactuals on which ad to assign a particular group.

This has 3 potential benefits

1) The first is that you may get better performance in some regards than facebook. This seems somewhat unlikely because Facebook is known to have good data. But it is a possibility.

2) The second is that you may be more efficient in ad expenditures than facebooks algorithm. This seems more plausible since we don’t know what facebook algorithm does under the hood and it seems likely to they bias it for their own profits, not yours.

3) Finally, One thing that the advertiser will most certainly get is knowledge on which demographics or targets are most susceptible to a particular kind of ad. This can be helpful for a number of reasons. As stated before facebook does not give much data on demographics that are susceptible to it. This can be used to target demo / interests outside of the Facebook platform.


One would have to run a lot of experiments but companies and political campaigns do that. Bloomberg reportedly runs experiments on 160 campaigns and spends millions of dollars on digital advertisement. I wonder if they try anything like this...
Posted by sam at 3:11 PM No comments:
Email ThisBlogThis!Share to XShare to FacebookShare to Pinterest

Sunday, October 13, 2019

Did Russia Use Manafort's Polling Data in 2016 Election?


Introduction:

On August 2, 2016 then Trump campaign manager, Paul Manafort, gave polling data to Konstantin Kalimnik a Russian widely assumed to be a spy. Before then Manafort ordered his protege, Rick Gates, to share polling data with Kilmnik. Gates periodically did so starting April or May. The Mueller Report stated it did not know why Manafort was insistent on giving this information or whether the Russian's used it to further Trump's cause (p. 130 see here for my summary of Mueller Report V1).

One theory says that Manafort wanted to show the good work he was doing to Kilimnik's boss, a Russian Oligarch named Deripiskia, whom Manafort owed money to. A more sinister hypothesis is that Manafort knew that the information would be valuable in the hands of Russian's trying to interfere with the election.

This post will analyze whether the Russians used the polling data irrespective of Manafort's intent. I looked at Russian Facebook Ads uncovered by House Intelligence Committee and tried to identify any changes in messaging after August 2nd. I conclude with a guess on what the polling data was shared.

Russian Facebook Data:

The House Intelligence Committee released  thousands of Russian Advertisements by the Internet Research Agency. There have been several analysis on these advertisements that discuss they're effectiveness and one good one is by Spangher et al. However, I couldn't find any that showed topics of advertisements over time.

I focused the analysis to data in 2016 which includes periods of Manafort coming into the position of campaign manager and the election itself in november. Overall there 1858 facebook Ads captured in this dataset. Below is a time series plot of number of Advertisements per day for 2016.

There are periods of high activity in May / June and in October right before the election.

Change After August 2nd?

Each advertisement has metadata and text associated with it including: date, text, target population, etc. To see if there were any changes through time and in particular august 2nd I tried some topic modeling and text clustering to see if there were any natural changes. I couldn't find any changes or trends using an unsupervised approach.

Instead I built a predictive model with the response being a binary variable; before  / after august 2nd and explanatory variables as text features from each ad (over 1200 words). I then performed variable importance on these words to see which were most predictive. Below I plotted the number of adverts with the important words divided by numer of advertisements for a particular day to get a normalized percentage.


The blue line is when Manafort made contact with Kilimnik initially and the red line is the august 2nd meeting. There does appear to be large increases in the words associated with African American civil rights topics after 8/2. Specifically these words were not in the advertisements texts themselves but were in the ‘people who liked’ description. That is, if you liked ‘Martin Luther King’ on your profile then a particular ad would target you.

Another way to look at this information is to see the proportion of these words used before and after 8/2.


The above plot shows the number of times a word appeared before and after 8/2 and the P(date>8/2) | word). For instance the word 1954, signifying the beginning of civil rights, occured 4 times before and 376 times after 8/2 which means that just under 99% of times it appears happen after that. This suggests there was a change in the IRA advertisements where they focused more on targeting people that were interested African American civil rights issues.

Conclusions / Discussions

I’m guessing that the contents of the polling data would be something related to African Americans and how those that have an interest in civil rights movement are more susceptible to negative ads.

Do I think the evidence presented here is that strong enough to believe the Russians used polling data? Meh, not really. For few reasons:

  • All words found here were used a few times before the 8/2
  • Gates gave information on a continuous basis. If Russians used this data I assume they would incorporate it accordingly and there would not be a discrete change at 8/2
  • I only did this for one date. Perhaps if I did this analysis for an arbitrary dates then I would find other words that were associated with other dates
I’m not saying that they didn’t use the polling data but I don’t think the evidence here is strong enough to say that they did. At a minimum I think that the IRA and Russians adapted Ads to target different populations at different points in time. This shows they are sophisticated and probably learn from previous results. 


Code

Posted by sam at 1:24 PM 8 comments:
Email ThisBlogThis!Share to XShare to FacebookShare to Pinterest
Labels: "R", R

Sunday, August 18, 2019

Mueller Report Volume 1: Network Analysis


settle down and have another cup of coffee

code

TLDR

There are a lot of Russian’s talking to a lot of Trump campaign members in Mueller report. There are so many it’s tough to get your head around it all. In this post I attempted some network analysis on the relations between campaign officials and Russians. I found that one can ‘compress’ Russian involvement into 9 (mostly) distinct groups. I then summarize these points of contacts.

Introduction to Mueller Report

Volume 1 of Mueller Report starts with Russian interference in 2016 US Presidential Elections. Russia did so in two Ways.

The first was a campaign by the IRA that used social media tools like facebook and twitter with the goal of changing public opinion. While there were some retweets by Trump and his campaign officials from these accounts there wasn’t much direct communication.

The second form was to use Russian intelligence to hack Hillary Clinton's emails. These hacked emails were released with help of wikileaks and guccifer 2.0. Trump’s campaign deliberately tried to find other hacked emails and encourages Russia to do so public. However, the campaign could not find additional information on these emails.

The rest of Volume 1 discusses the numerous relationship between trump campaign officials and Russians. It’s this part that will be the basis for most of the results below.

The data

Volume 1 consists of 199 pages including foot-notes and appendices. I found a machine readable version here. I split the text into sentences and looked at whether a person’s name was included in that sentence. This left me with a sentence by name matrix that is the starting point of my analysis. There are some drawbacks to this in that OCR does not immediately distinguish sentences. In addition it often groups footnotes with last line of sentences in a page. But it seemed like a good starting point so went ahead.

Below are the top 20 most common occurring names. 
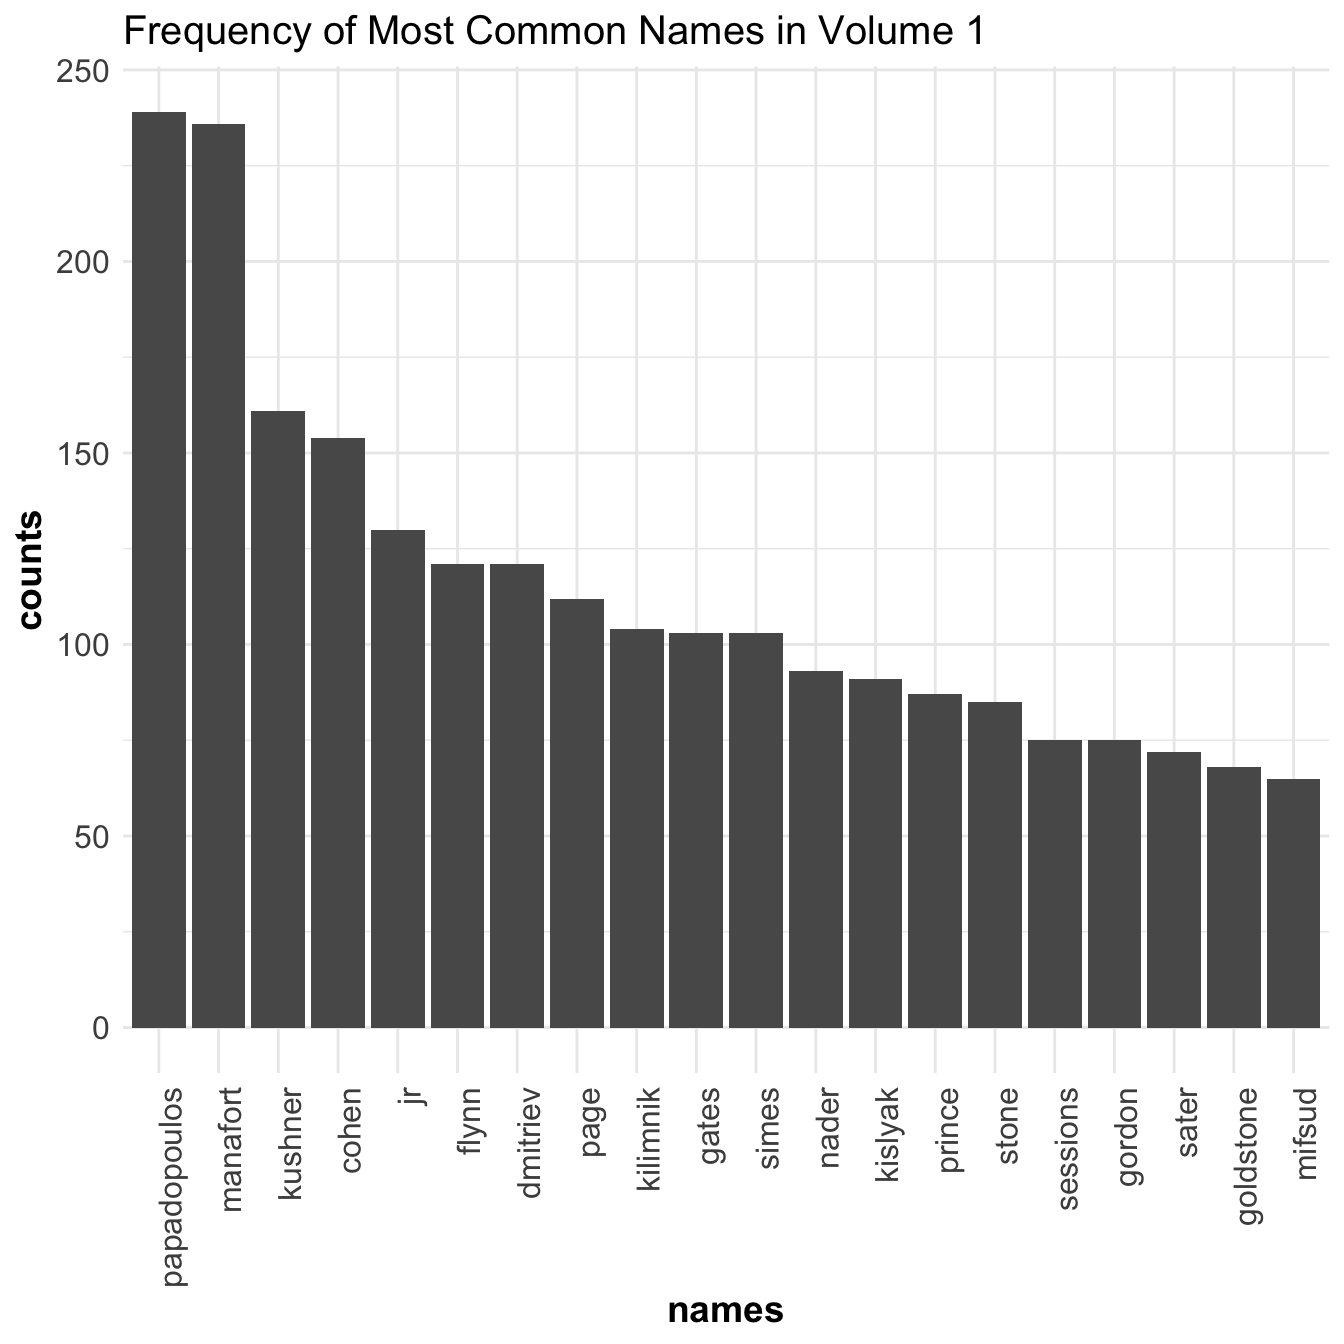
Papadopulos, Manafort, Kushner, Cohen, Trump JR, and Flynn are all in the top. Considering they were all, to varying degrees, worked in the Trump campaign this makes sense. We also see some Russian names such as Dmitriev, Kilimnik, and Kislyak. I’ll explain their contacts below.
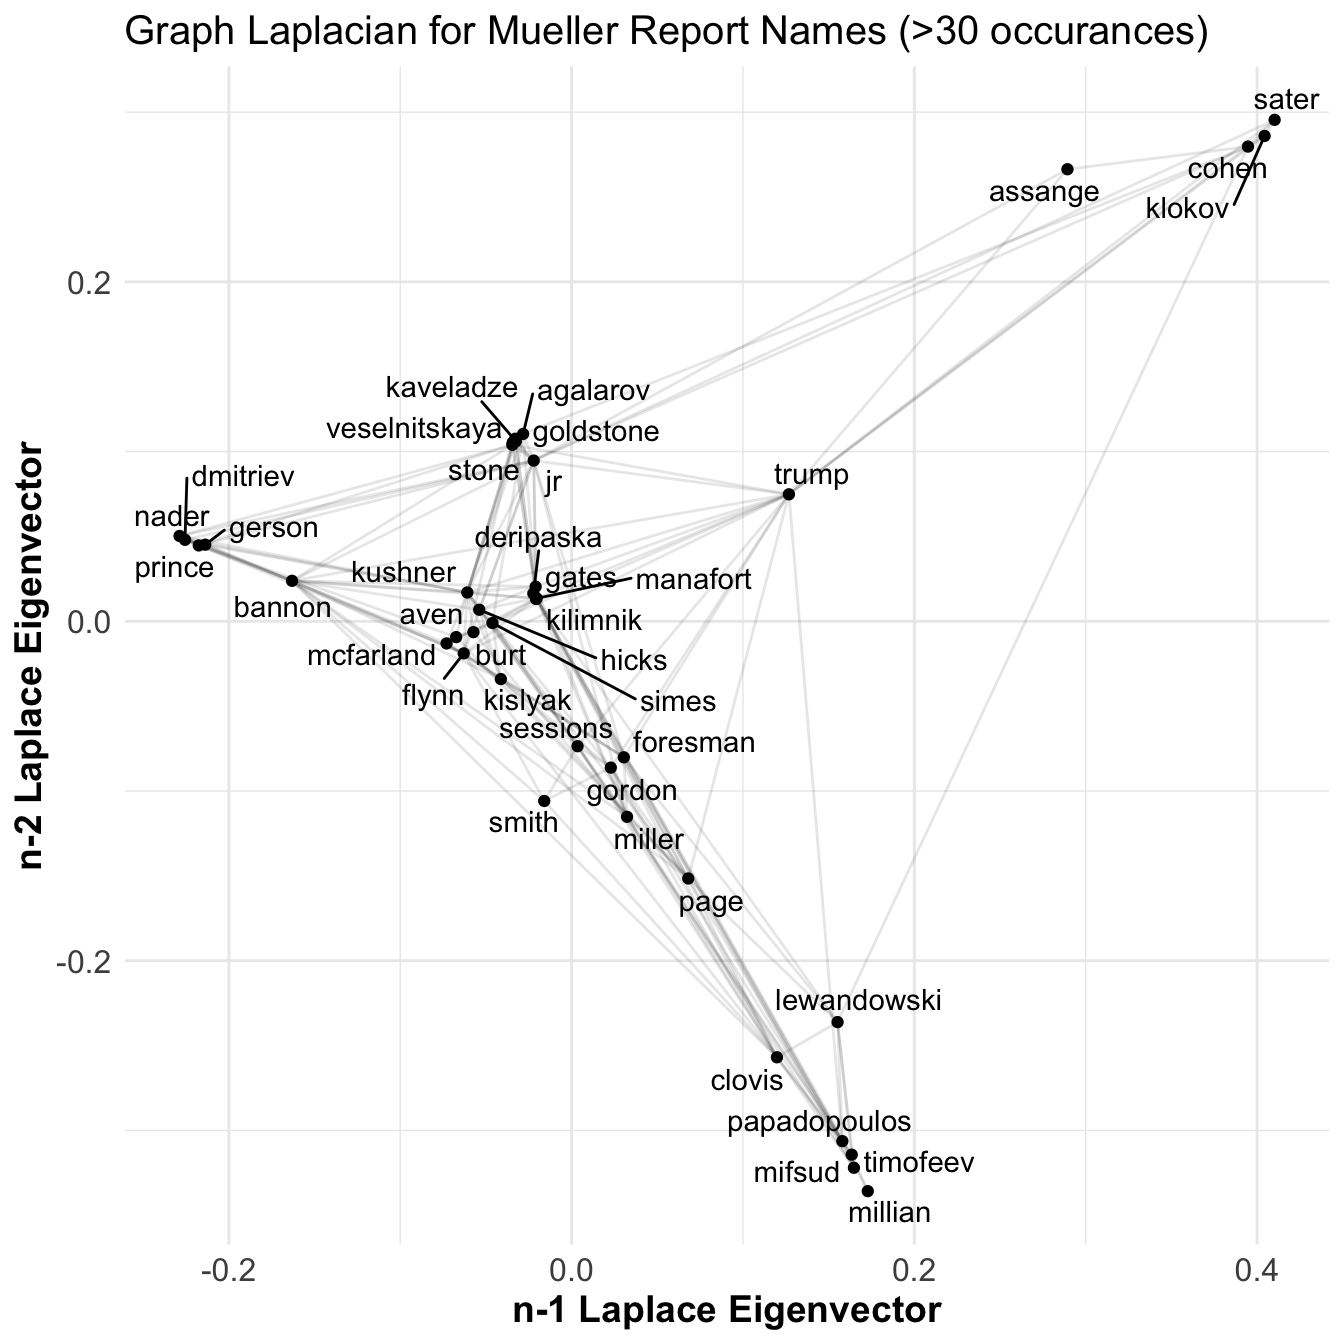
I then created a person x person matrix that counted the number of times a name co-occurs with another. I’m treating this as a weighted, undirected graph. I transformed this to a laplacian matrix and performed an eigen decomposition. This is known as a spectral analysis of a network. Basically this tries to find locations that minimizes the square error of the relations. Below is the resulting image of 2nd to last and 3rd to last eigenvectors.

WHOA … I’m getting a headache looking at this.

But it definitely looks like there is structure in the graph. There appears to be some clusters forming and these do correspond to particular events described in the report. In the lower left you can see Papadopoulos related characters, in the upper right some cohen acquaintances, and around 0,.1 there’s the trump tower meeting. Not bad but still messy. I’m looking for distinct clusters.

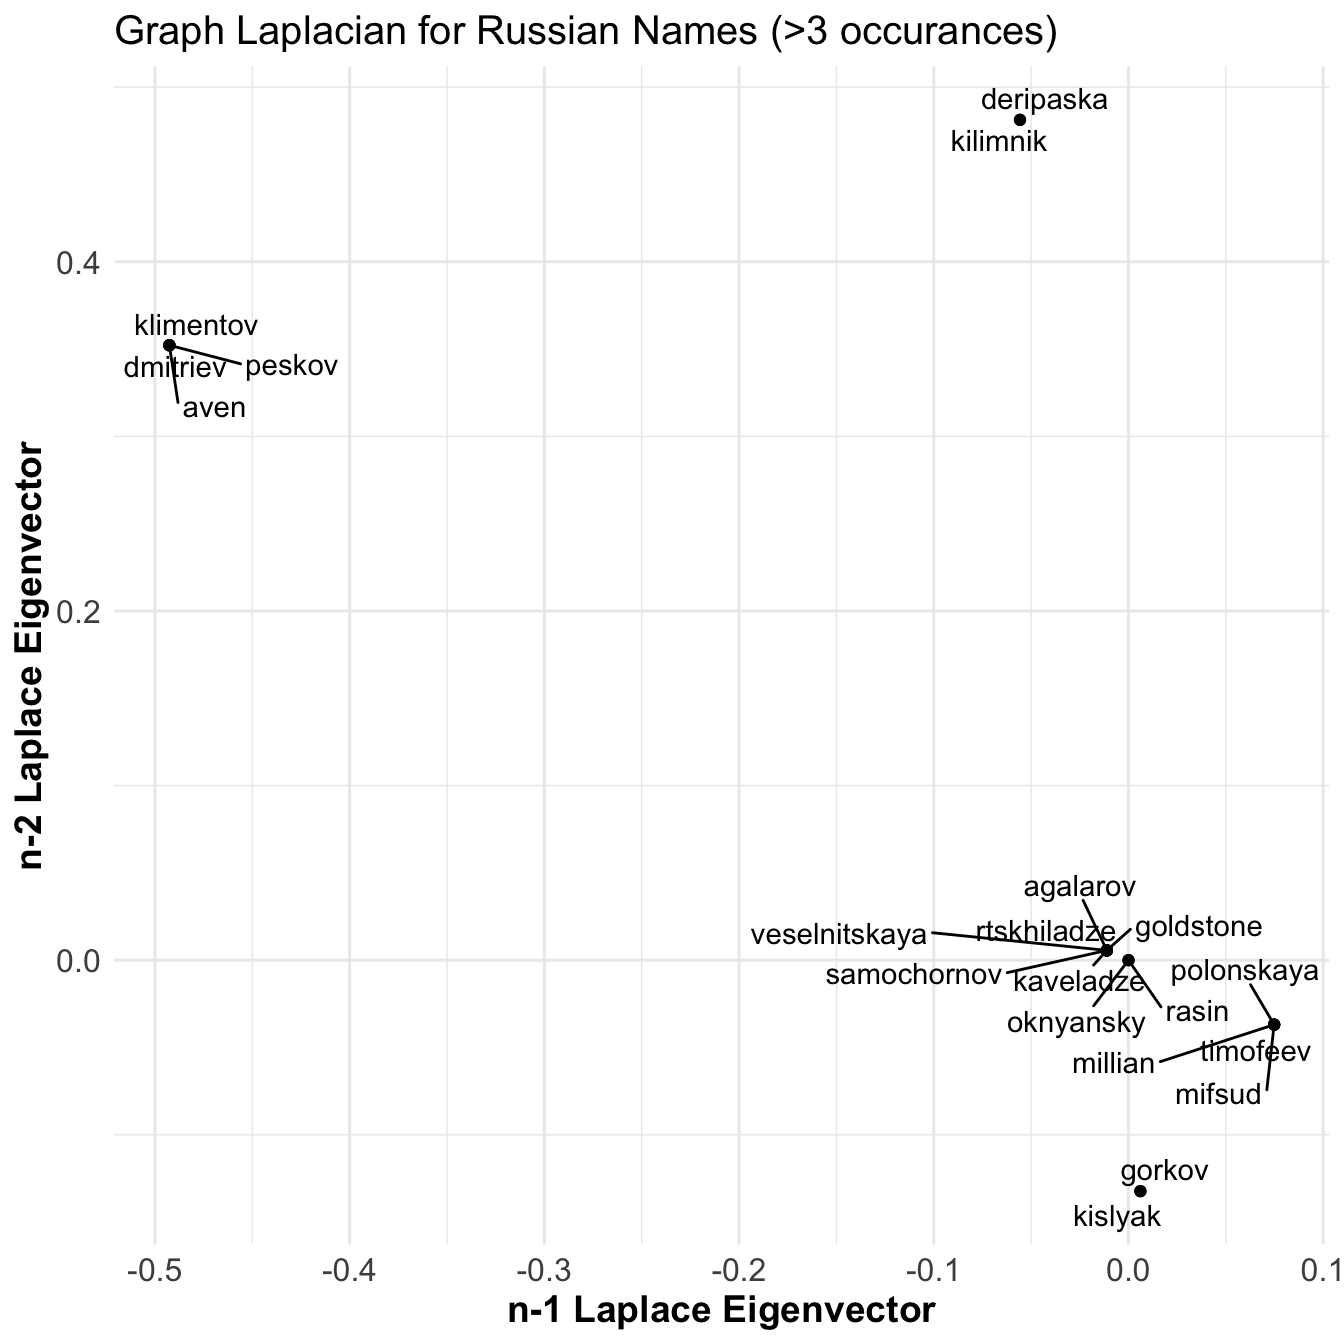
What if we look at only the Russians in the graph?

Ok! Now we’re talking. There are 6 distinct clusters of Russians here. That means there are no relations between these clusters and each correspond to a unique set of relations with trump campaign officials. I played around with this some more but the text data was too messy to have robust analysis. Co-occurring names do not pick up everything and due to sentence parsing errors somethings lead to erroneous relations.

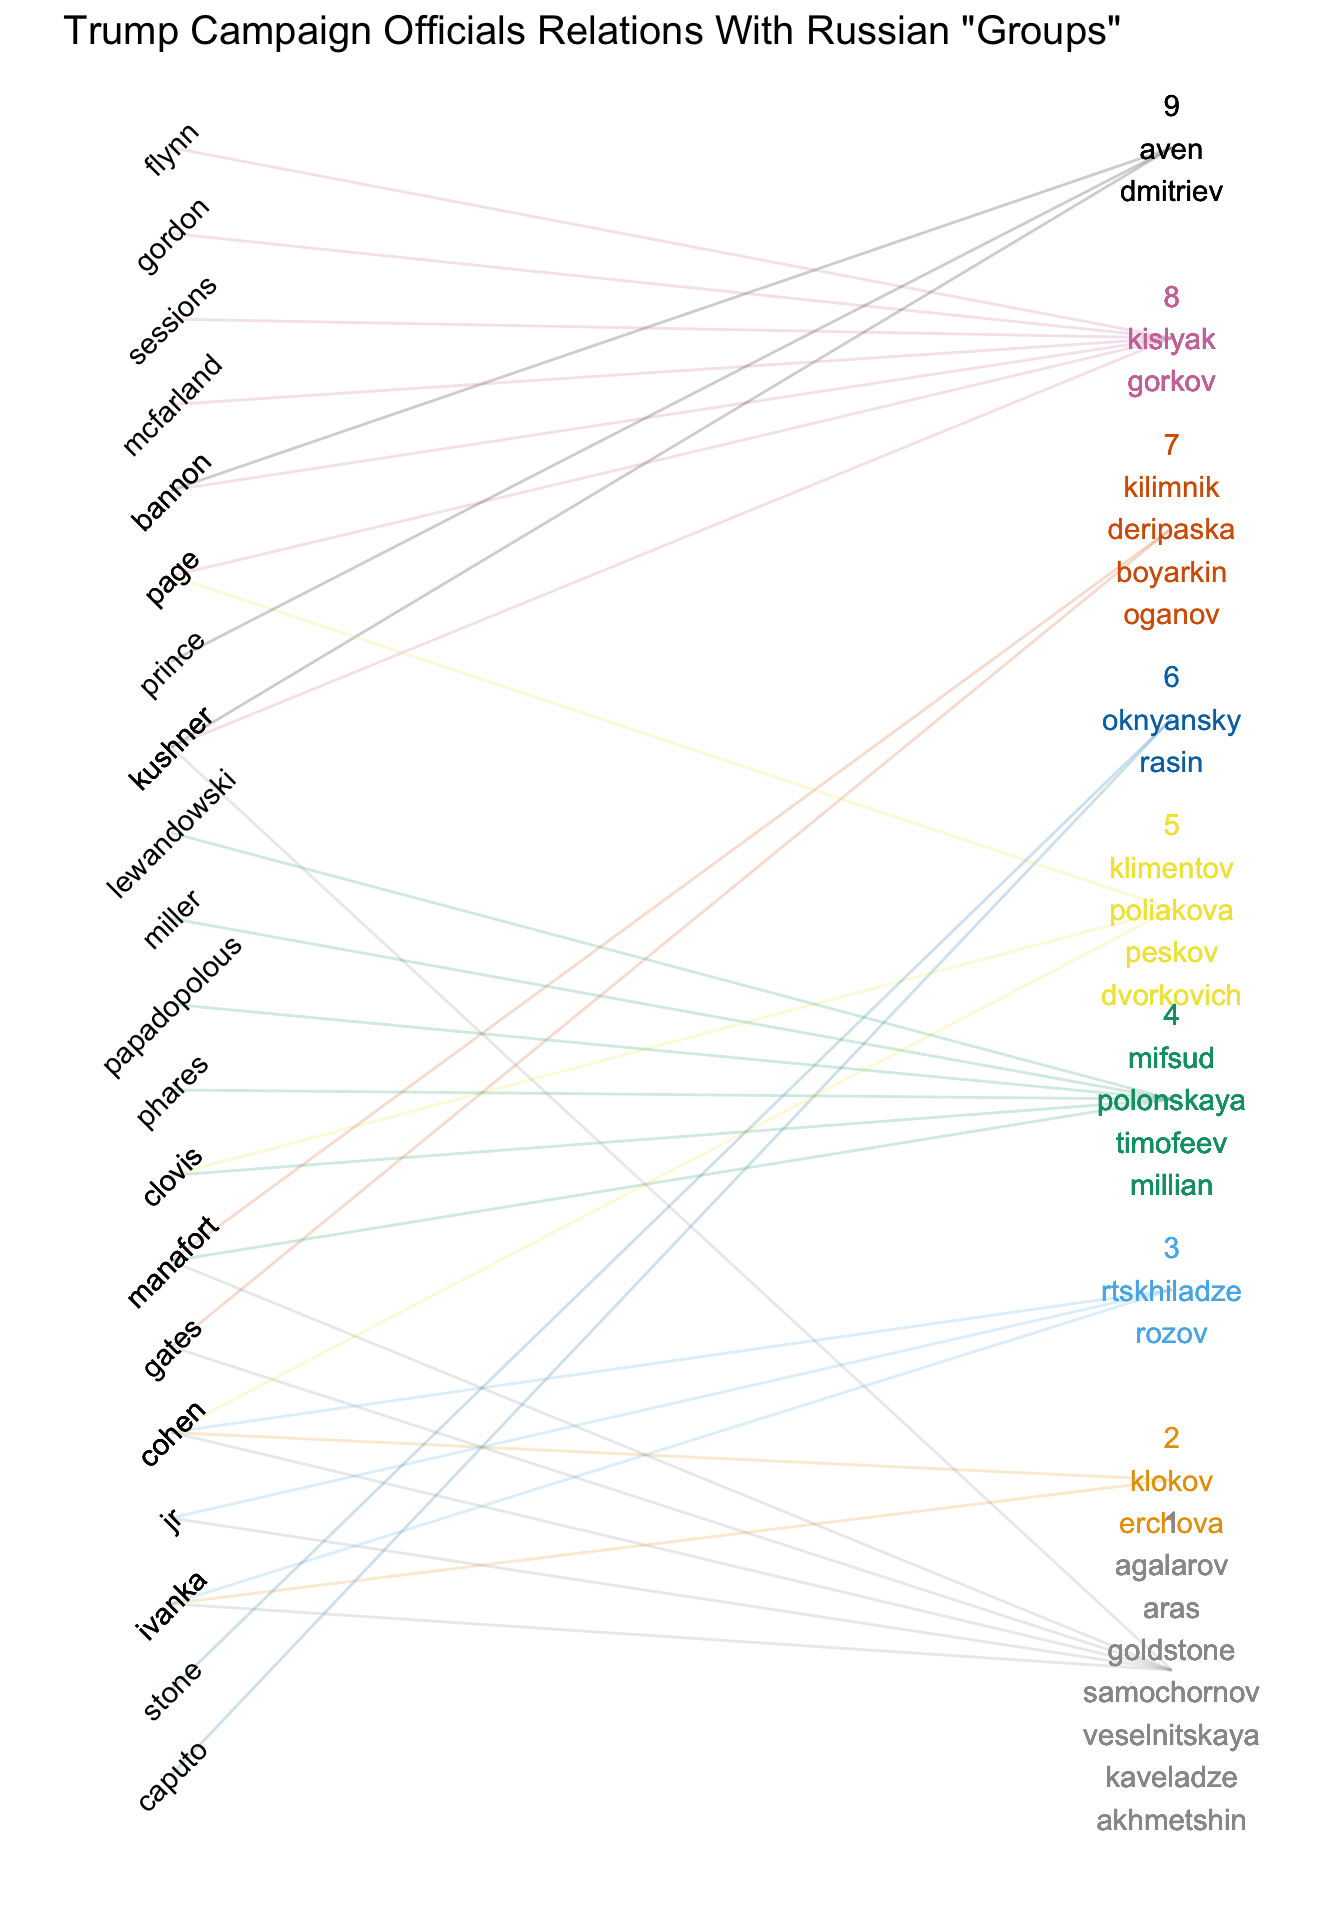
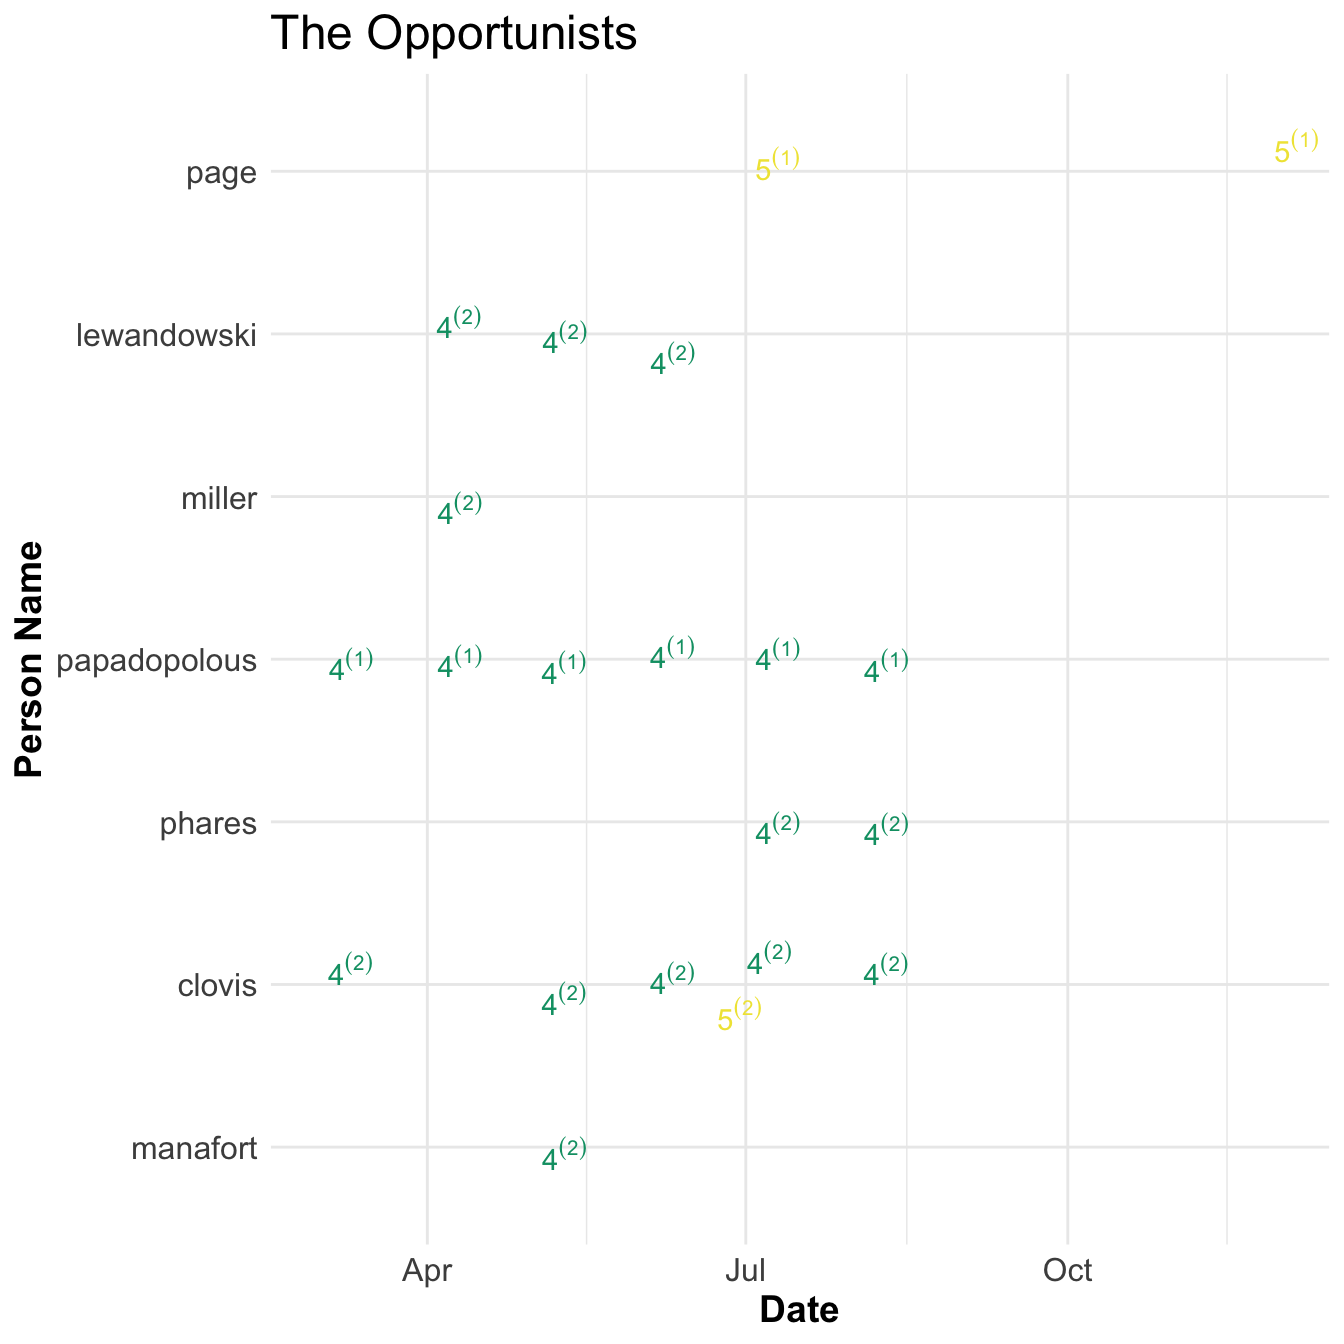
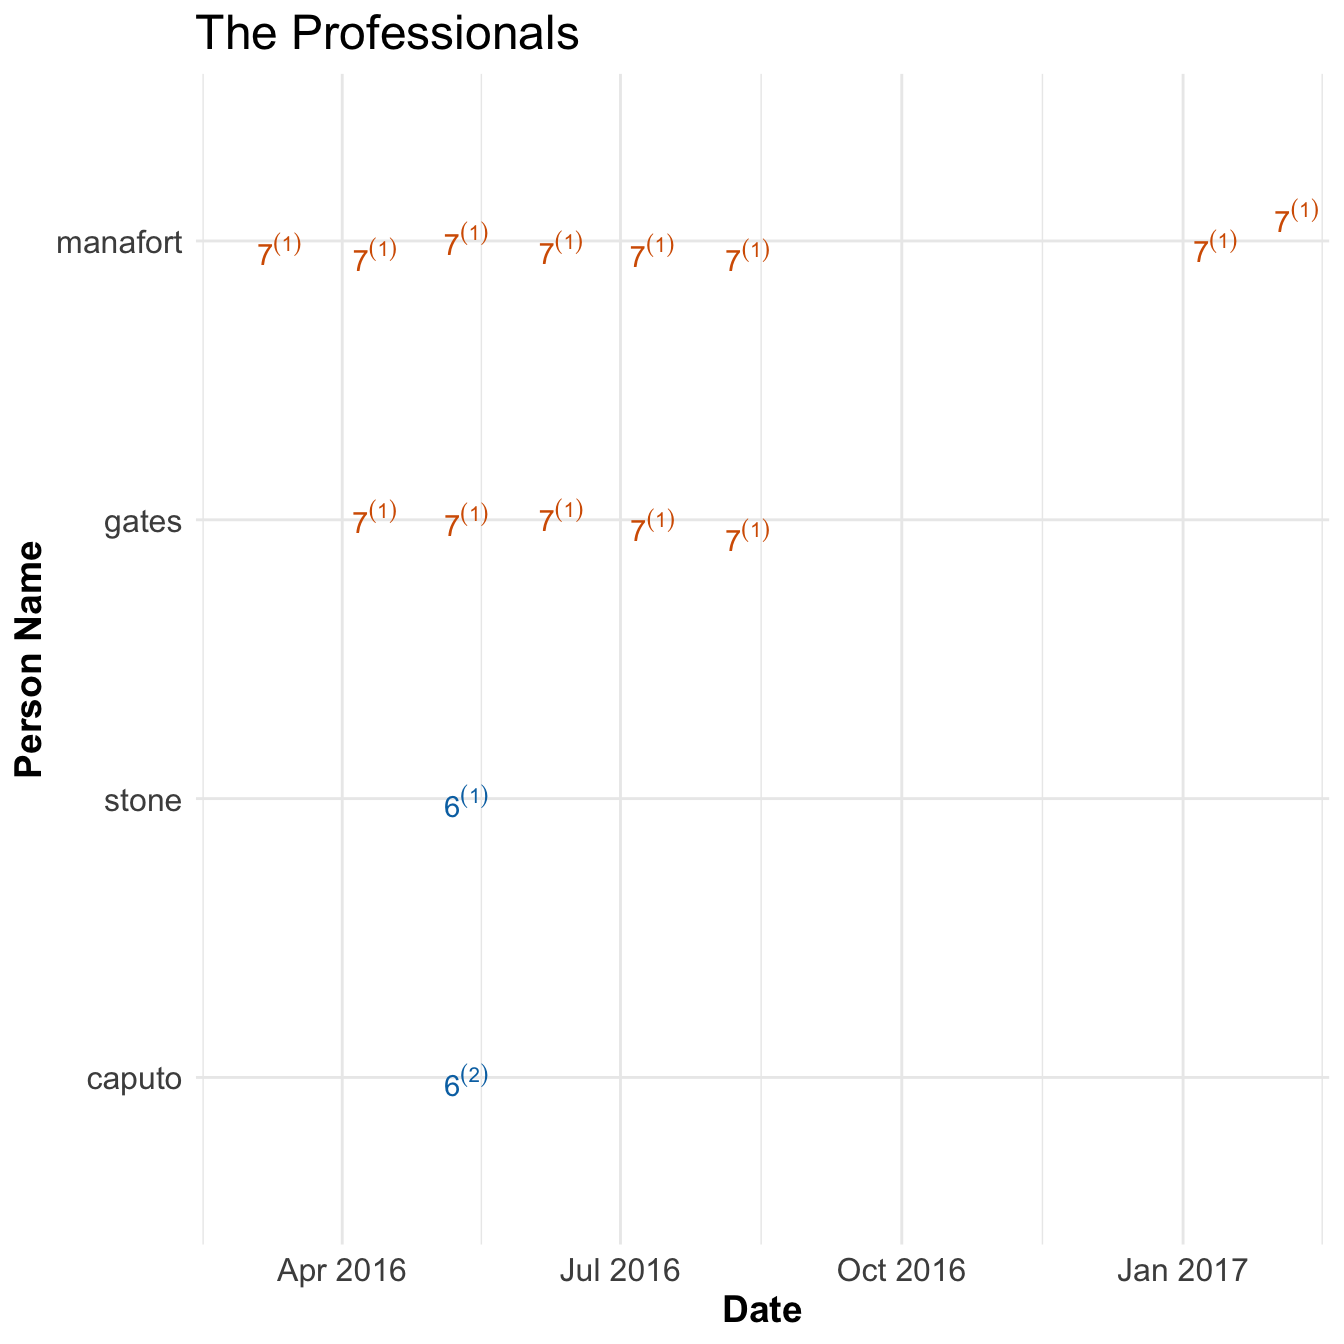
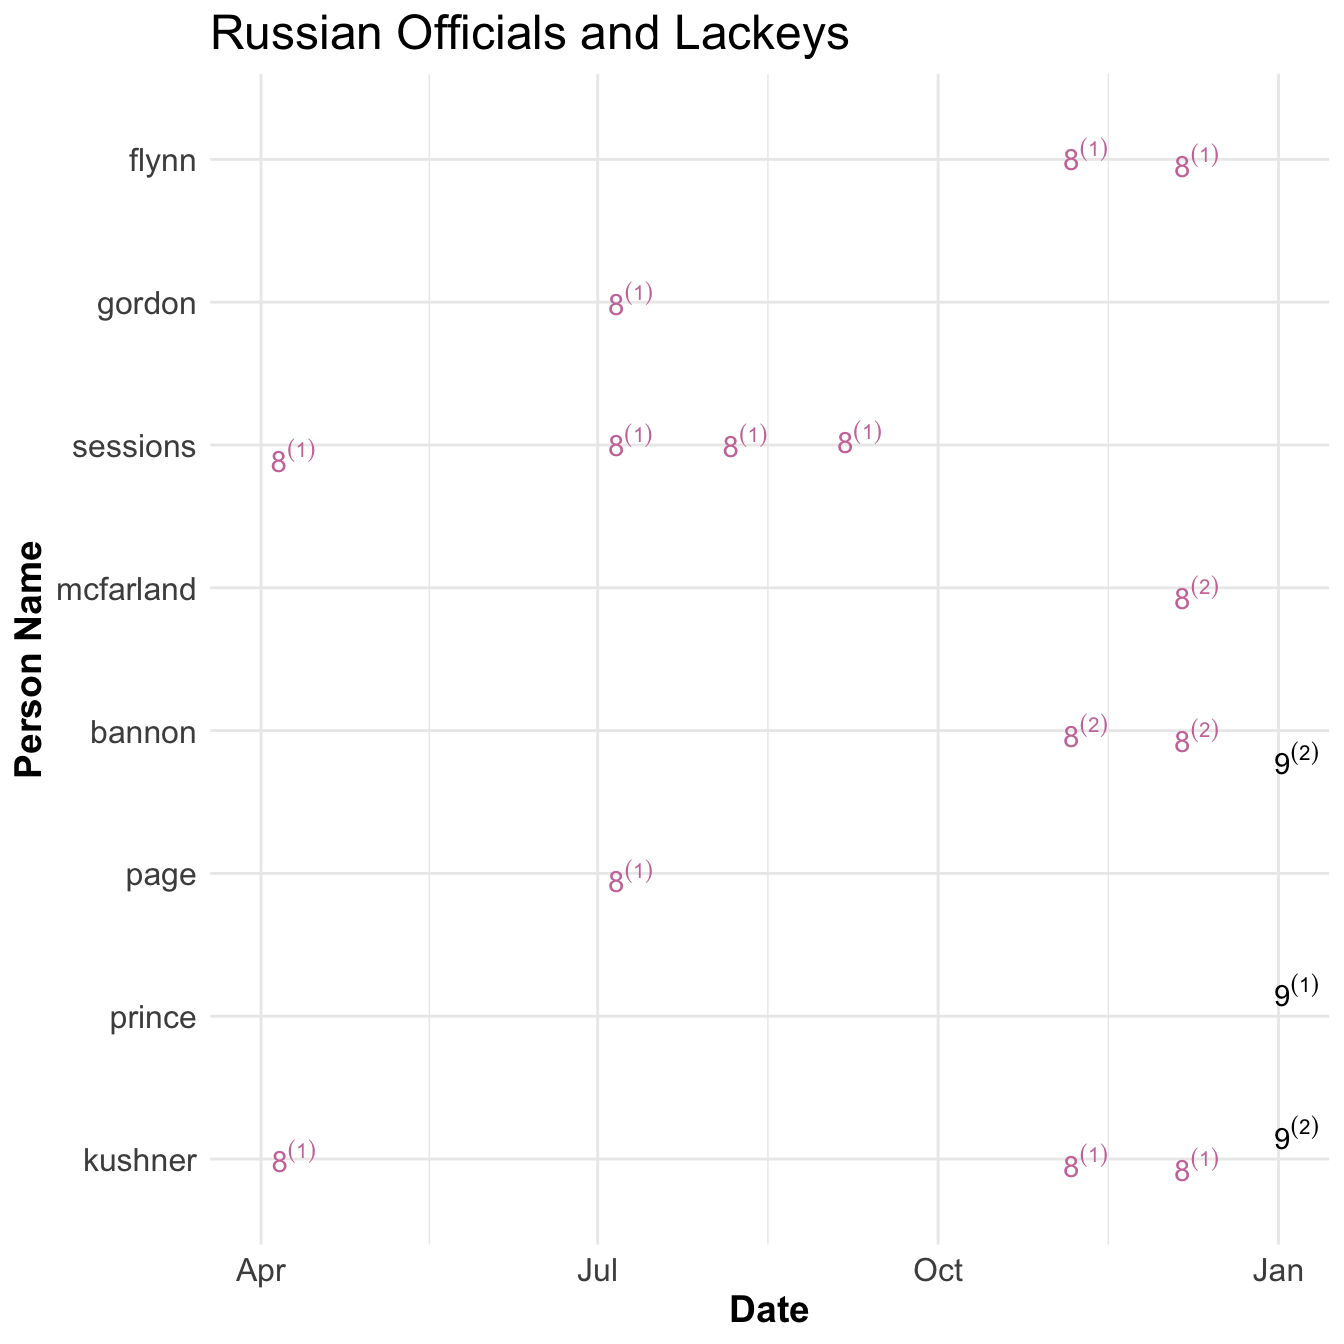
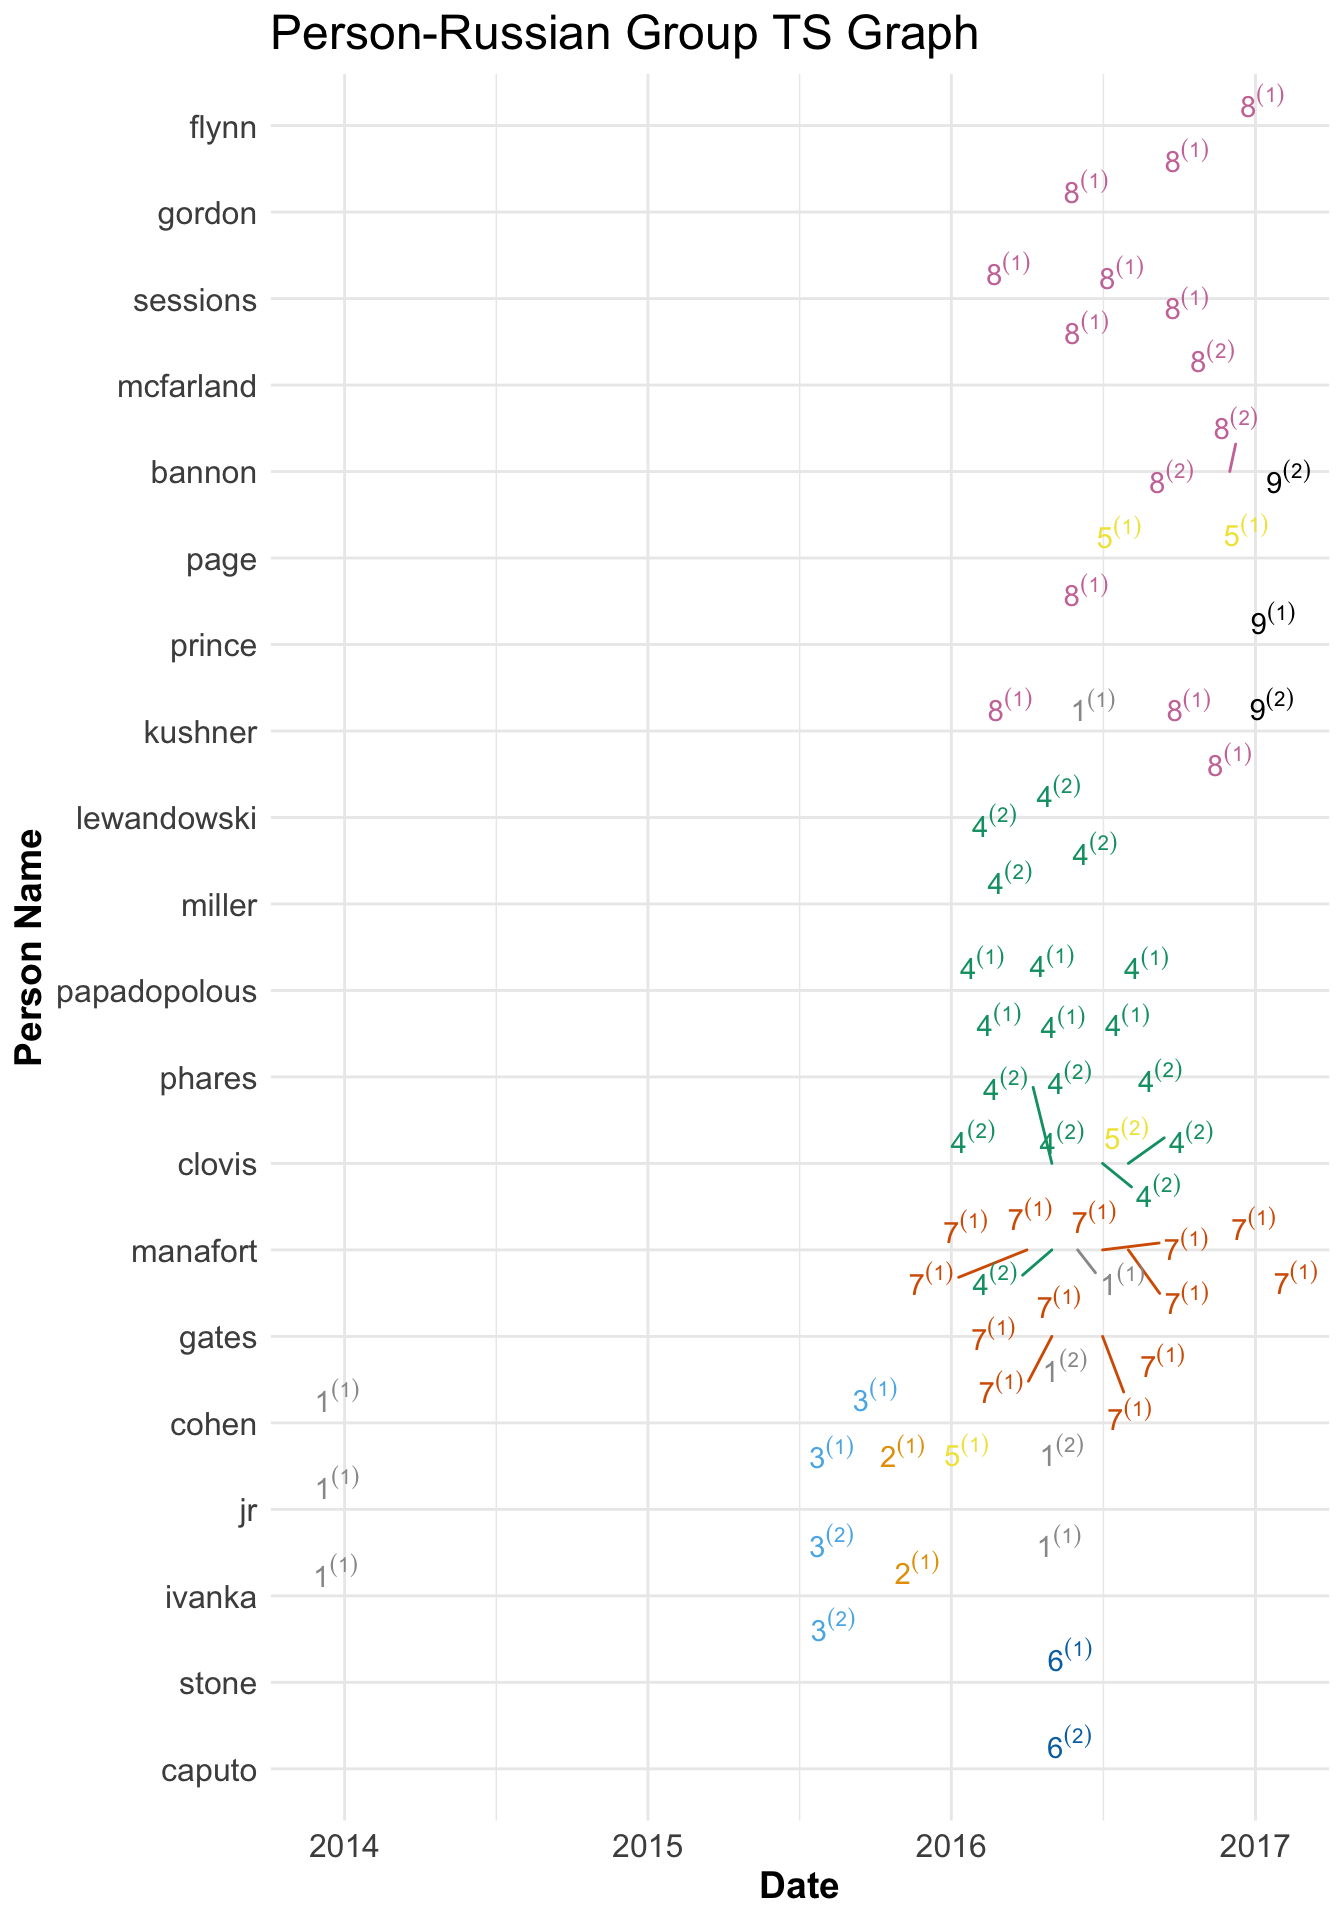
Finally, I gave up on trying to only use text analysis, read volume one, and manually created a network found here. With that I created groupings using the above chart as a starting point. I found 9 fairly distinct clusters of Russians. Below you can see the relationships between those groups and various members of the Trump campaign.


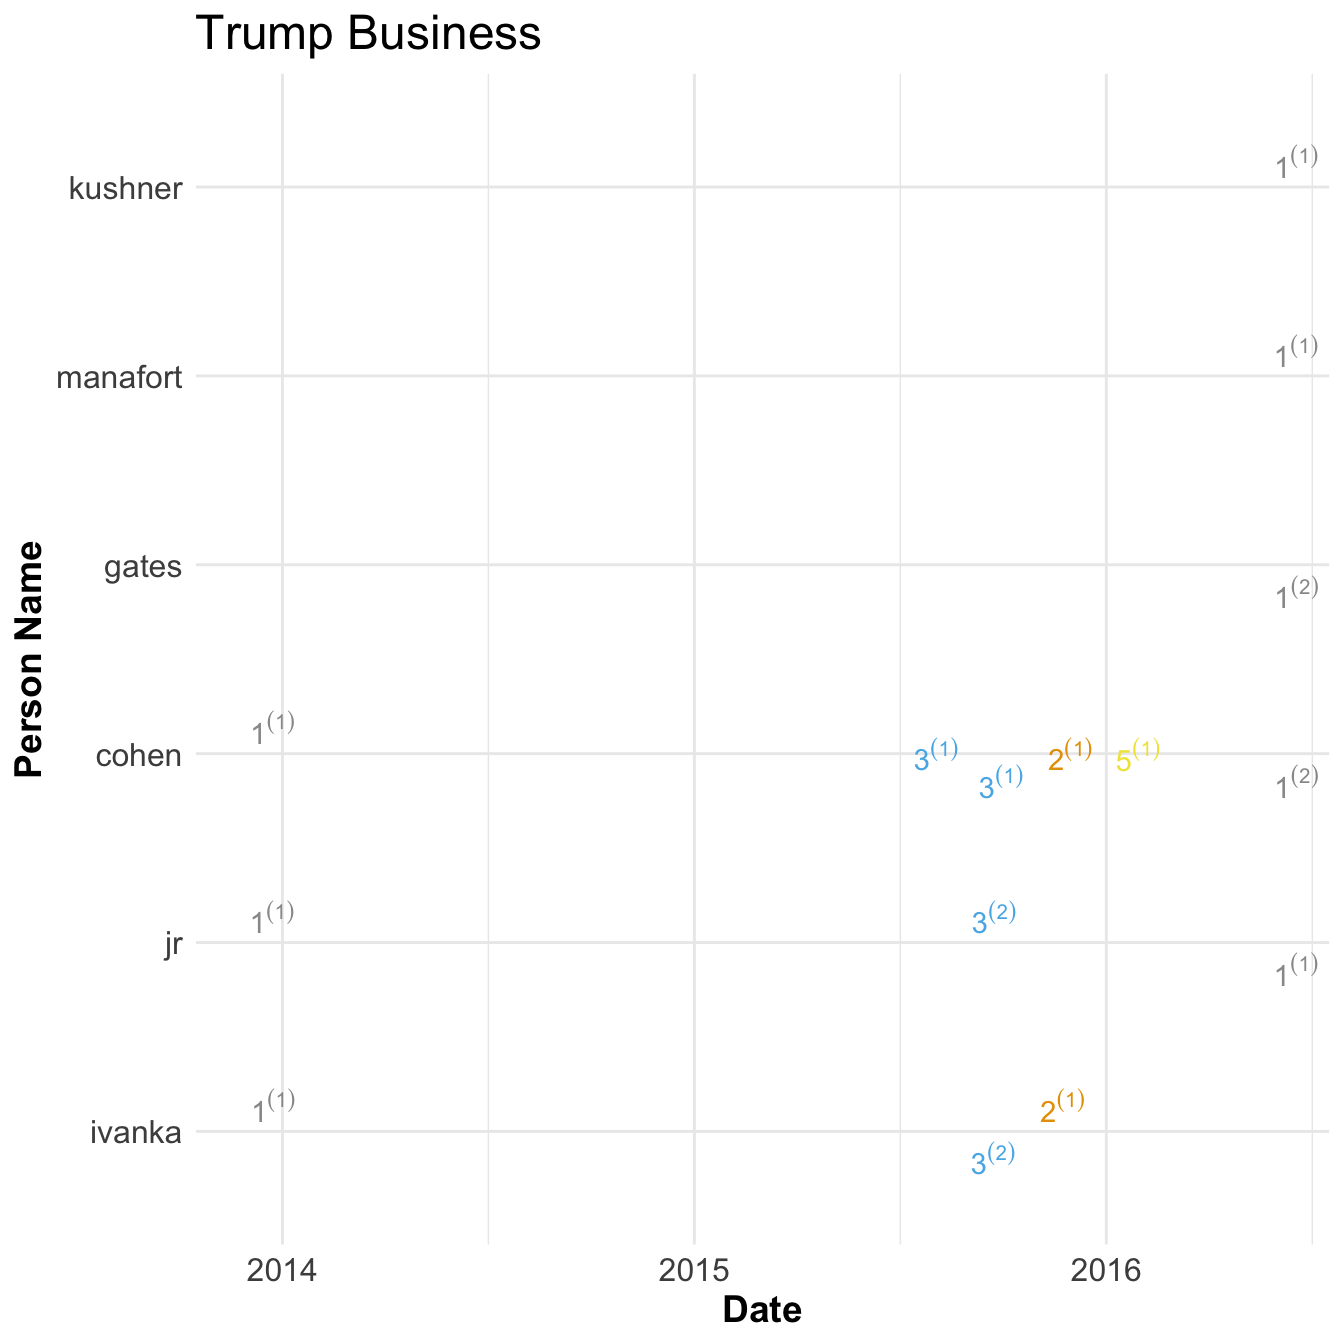
I then further grouped them into 4 broad categories which I’ve named; Trump Business, The Opportunists, The Professionals, and Russian Officials and Lackeys. I also included whether a trump campaign officials interaction was of first degree (they were in meeting or talked explicitly with Russian Group in question) or second degree (they were aware of meeting). Below are my summaries for each.

Trump Business

  • Group 1
    • agalarov, aras, goldstone, samochornov, veselnitskaya, kaveladze, akhmetshin
  • Group 2
    • klokov, erchova
  • Group 3
    • rtskhiladze, rozov
  • Group 5
    • peskov
Aras Agalorov (he has a son Emin. I did not disambiguate the difference between them) is a billionaire Russian Property Developer that worked with trump to create Miss Universe Pageant in 2013. They Discussed creating a Trump tower in moscow in late 2013 and discussed with Donald Trump JR (DTJ) and Ivanka Trump but did not progress.

In Summer of 2015 Group 3 signed a letter of intent to build the trump tower in moscow and met with Ivanka and DTJ.

While this was happening Group 2 contacted cohen to discuss Trump tower in moscow and a meeting with Trump. Cohen thought this person was a pro-wrestler but that did not seem to bother and agreed to talk about business. They wanted to set up a meeting with Trump and Putin but Cohen wanted to keep clear of politics and it went nowhere.

Finally, due to the slowness of progress in Trump Tower Moscow deal from Group 2 cohen reached out to Peskov, Press Secretary for Putin, to try and get in touch with Putin directly and begin building. Cohen worked on moscow deal through summer of 2016 but it went nowhere.
During campaign the Emin Agalorov, at the behest of his father, setup a meeting with DJT to discuss hacked emails. This lead to the infamous Trump Tower meeting that involved DJT, Kushner, and Manafort and other Russians in Group 1. DJT discussed this meeting with others in the campaign as well including Gates. Kushner showed up late to the meeting and texted manafort during that this was a ‘waste of time’ and texted others to call him to get out and he subsequently left early. The meeting did not provide any information to Trump campaign.

The Oppurtunists

  • Group 4
    • mifsud, polonskaya, timofeev, millian
  • Group 5
    • klimentov, poliakova, peskov, dvorkovich
Papadoplous and Page had similar experiences with the Trump campaign and they both seemed to be in it for the opportunity it presented themselves. Both padded his resume to look more important than he was to get the job and both foreign policy advisory roles.

Papadoplous got the job of foreign policy advisor in march 2016. He met Mifsud, a Maltese Professor, in Rome at a meeting for London Centre of International Law Practice shortly after. Upon learning that Papadoplous was employed by campaign Mifsud took interest and spoke of his Russian connections. Papadopolous, thinking that having more russian connections could help his stature in the Trump Campaign, pursued this relationship. They met the following week in London where Mifsud introduced him to Polonskaya. Papadopolous relayed his new contacts with Clovis and received an approving response. This relationship continued and Mifsud said Russia had ‘dirt’ on Clinton during a meeting in late April. Ten days later he told a foreign official about his contacts and knowledge of dirt on Clinton. He then discussed a Trump meeting with Putin to Lewandowski, Miller, and Manafort. Manafort made clear that Trump should not meet with Putin directly.

Page also joined the campaign in march 2016 as a foreign policy advisor. He had previously lived and worked in Russia and had several Russian contacts. He was invited to talk to the New Economic School in Russia in July and asked for permission. Clovis responded that if he went he could not speak for Trump Campaign. His talk was critical of US policy towards Russia and was received welcomingly from Russian Deputy Prime Minister and others. After he met Kislyak in July in Cleveland. These activities drew the attention of the media and was removed from campaign in late september.

After Election Page went to Russia in an unofficial role after the election in late 2016. He again met with Russians in Group 5.

The Professionals

  • Group 6
    • oknyansky, rasin
  • Group 7
    • kilimnik, deripaska, boyarkin, oganov
Paul Manfort and Roger Stone are political consultants and previously worked together. Roger Stone worked alongside the campaign to help but was never officially apart of the campaign. Manafort joined in March 2016 and was the chairman between June and August.

Caputo set up a meeting Stone with Group 6, Oknyansky and Rasin, to get dirt on Clinton in May 2016. Rasin claimed to have information on money laundering activities by Clinton. Stone refused the offer because they asked for too much money.

Also, Stone had some contact with the twitter account Guccifer 2.0 (not shown above). This was the front used by the GRU to release stolen documents. Curiously, his name was redacted on page 45 in the Mueller report because of ‘Harm to ongoing matter’. Seems a little weird to redact something when it’s public information.

From March 2016 until his depart Manafort gave and ordered Gates to give campaign updates to Kilimnik. Kilimnik is thought to be a Russian spy and has connections with Deripaska, a Russian billionaire who Manafort owed money to. Manafort gave polling data on the Trump campaign and met with Kilimnik twice in person; once in May and then again in August. It’s not clear why Manafort gave this data to Kilimnik although Gates thought it was to ingratiate himself to Deripaska. Deripaska and his deputy Boyarkin were subsequently sanctioned by the US Treasury.

Russian Officials and Lackeys

  • Group 8
    • kislyak, gorkov
  • Group 9
    • aven, dmitriev
The final groups deal with Russian Officials and and Putin’s Billionaires.
Sessions and Kushner met with Kislyak, the Russian Ambassador to the US, first in April at a Trump Foreign Policy Conference. These were brief handshake affairs that lasted about a couple of minutes. Sessions does not recall seeing Kislyak.

Sessions, Gordon, and Page met with Kislyak at the Republican National Convention in July. He was one of approximately 80 foreign ambassadors to the US that were invited. Gordon and Sessions met with Kislyak for a few minutes after their speeches. Gordon, Page, and Kislyak later sat at the same table and discussed improving US Russian Relations for a few minutes.
Gordon received an email in August to meet with Kislyak but declined due to ‘constant stream of false media stories’ and offered to rain check the meeting.

In August Russian Embassy set up a meeting with Sessions in Kislyak and the two met in September at Session’s Senate office. Meeting lasted 30 minutes and Kislyak tried to set up another meeting but Session’s didn’t follow up. Sessions got into trouble by not disclosing his meetings with Kislyak and was part of the reason he recused himself from what became known as the Mueller report.

Following the election in November Kislyak reached out to Kushner but Kushner did not think Kislyak had a direct line to Putin and was therefore not important enough to talk to. Nevertheless Kushner met with Kislayk in November at Trump tower and invited Flynn and spoke for about 30 minutes about repairing US Russian Relations. Kislyak suggested using a secure line to talk to Russian generals about Syrian war. Kushner said he had no secure lines to use and asked if they could use russian facilities but Kislyak rejected that idea.

Kislyak tried to get another meeting with Kushner but Kushner sent his assistant instead. Kislyak proposed meeting with Gorkov, the head of a Russian owned bank, instead. Kushner agreed and they met in December. Kushner said that meeting was about restoring US - Russian Relations. Gorkov said it was about Kushner’s personal business. They did not have any follow up meetings.

In december Flynn talked with Kislyak about two separate topics. The first was to convince Russia to Veto anti-Israel resolution on settlements in the UN where it was thought the Obama administration would abstain. Russia did not vote against it. The second was to convince Russia not to retaliate against new sanctions for meddling in US elections. Mcfarland and Bannon were aware of Flynn’s discussions about the sanctions. Russia did not apply retaliatory sanctions.
Finally there were two billionaires men that Putin ‘deputized’ to create contacts with the Trump Campaign after the election; Aven and Dmitriev. Aven said recalled that Putin did not know who to contact to get in touch with President Elect Trump. Aven did not make direct contact to campaign but Dmitriev did through two avenues. One was to try and convince Kushner’s friend to setup a meeting. Kushner circulated this opportunity internally but it went nowhere. The other was meeting with Erick Prince, a supporter of Trump but not officially in campaign, in the Seychelles Islands. Prince discussed his meeting with Bannon but Bannon does not have a recollection of it.

Some notable connections

In general these Russian Groupings were distinct in the people they talked to and had little obvious contact with one another. Some notable exceptions are:
  • Peskov talked to Cohen and Page independently
  • Dmitriev and Peskov might have talked to eachother (p. 149) but there was some ‘investigative technique’ redactions so I’m not sure
  • Kilimnik was aware of Page’s December visit to Russia and discussed with Manafort saying “Carter Page is in Moscow today, sending messages he is authorized to talk to Russia on behalf of DT on a range of issues of mutual interest, including Ukraine” p. 166. Leads me to ask: who would know the whereabouts and discussions of other people? Spies. Thats who.

Conclusions on Volume 1

Overall, I get the impression that the Trump campaign did not have the ‘best people’. Cohen tried to make a deal but couldn’t find the right people to talk to. Papadopolous and DJT tried to get dirt on Clinton but couldn’t find anything. Page seemed to use the campaign as a platform to create more connections with Russians. A few ‘friends’ (Stone and Prince) lent a hand but probably hurt Trump’s credibility by dealing with Russians more than they helped him. Manafort, a seasoned campaigner, wasn’t obviously working for Trump… he worked for free after all. It seemed like a group that were willing to do shady things, for their own personal gain, but without the ability to follow through.
SAD!

All Together Graph

Conclusions on Analysis

Running text analysis before reading report was very helpful to understanding it. There are just so many connections going on it’s hard to keep track. Running some basic clustering techniques as described above helped me zone into what to look for while reading the report.
Posted by sam at 5:46 PM No comments:
Email ThisBlogThis!Share to XShare to FacebookShare to Pinterest
Labels: "R", R

Wednesday, September 5, 2018

Who wrote nytimes resistance article?

# nytimes_resistance_letter
Which senior cabinet wrote nytimes 'resistance' article?

Below ranking of each cabinent member. Azar, Acosta, or Haley are most likely to have written article based on data analysis.


['rick perry', 1]
['Kelly_John', 2]
['kirstjen nielsen ', 2]
['mulvaney', 3]
['coats', 3]
['gina haspel', 4]
['mnuchin', 5]
['elaine chao', 5]
['mcmahon', 6]
['mike pomeo', 7]
['sonny perdue', 8]
['mattis', 8]
['zinke', 8]
['ben carson', 8]
['wilbur ross', 8]
['devos', 9]
['Robert Lighthizer', 9]
['sessions', 10]
['Robert L. Wilki', 10]
['haley', 10]
['acosta', 11]
['azar', 16]


I scraped each person's opening testimony as a dataset. I then split each person testimony into sentences. I built a model to predict who wrote a sentence given it's features (bigrams of words and characters).
Applying model to each sentence of resistance article gave a probability that a cabinent member wrote that sentence.
I set a threshold of .1 for each sentence probability; if a person recieved a probability greater than .1 then they were giving a 1 else 0 for that particular sentence. The above ranking is the sum of those scores.


code
Posted by sam at 9:50 PM No comments:
Email ThisBlogThis!Share to XShare to FacebookShare to Pinterest
Newer Posts Older Posts Home
Subscribe to: Posts (Atom)

My Blog List

  • R-bloggers
    How to learn C++ as an R user? - Because of delays with my scholarship payment, if this post is useful to you I kindly ask a minimal donation on Buy Me a Coffee that shall be used to con...
    1 day ago

About Me

sam
View my complete profile

Blog Archive

  • ▼  2024 (1)
    • ▼  June (1)
      • pRotectionism: The way to compete in 2024
  • ►  2023 (2)
    • ►  August (1)
    • ►  May (1)
  • ►  2022 (4)
    • ►  August (1)
    • ►  June (2)
    • ►  February (1)
  • ►  2020 (8)
    • ►  December (1)
    • ►  November (1)
    • ►  June (1)
    • ►  May (1)
    • ►  March (2)
    • ►  January (2)
  • ►  2019 (2)
    • ►  October (1)
    • ►  August (1)
  • ►  2018 (2)
    • ►  September (1)
    • ►  April (1)
  • ►  2017 (3)
    • ►  August (1)
    • ►  June (1)
    • ►  January (1)
  • ►  2016 (4)
    • ►  June (1)
    • ►  May (1)
    • ►  January (2)
  • ►  2015 (4)
    • ►  December (1)
    • ►  October (1)
    • ►  April (1)
    • ►  March (1)
  • ►  2014 (11)
    • ►  October (1)
    • ►  August (1)
    • ►  July (1)
    • ►  May (2)
    • ►  April (2)
    • ►  January (4)
  • ►  2013 (20)
    • ►  November (1)
    • ►  October (1)
    • ►  September (3)
    • ►  May (3)
    • ►  April (6)
    • ►  March (1)
    • ►  February (3)
    • ►  January (2)
  • ►  2012 (2)
    • ►  December (2)
Simple theme. Powered by Blogger.